Real time
To view the real time data of the repository follow the steps below:
- Log in to the Repository.
- Click on the Repository Name to view the Monitoring Details.
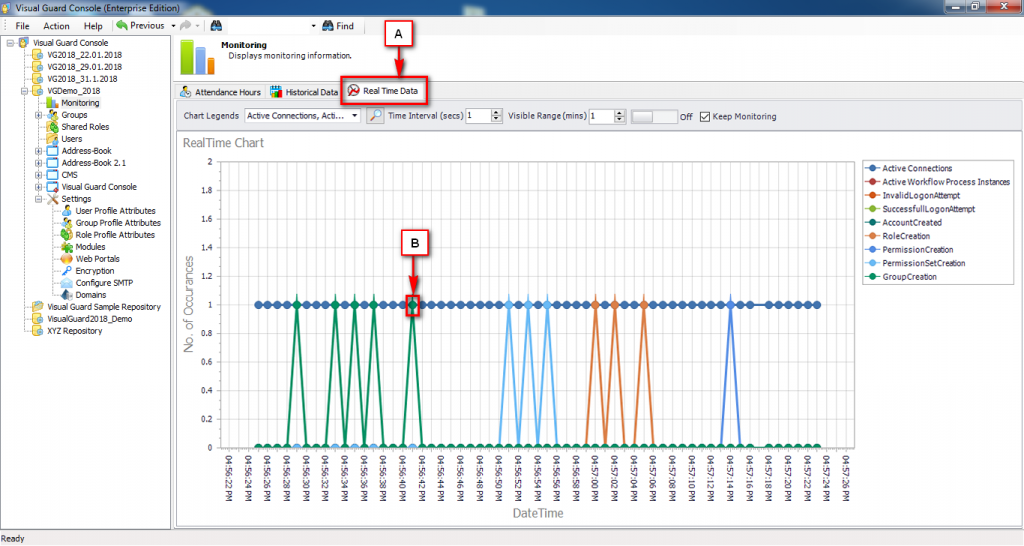
- Select the Real Time Data Tab (A) from the Monitoring Tab

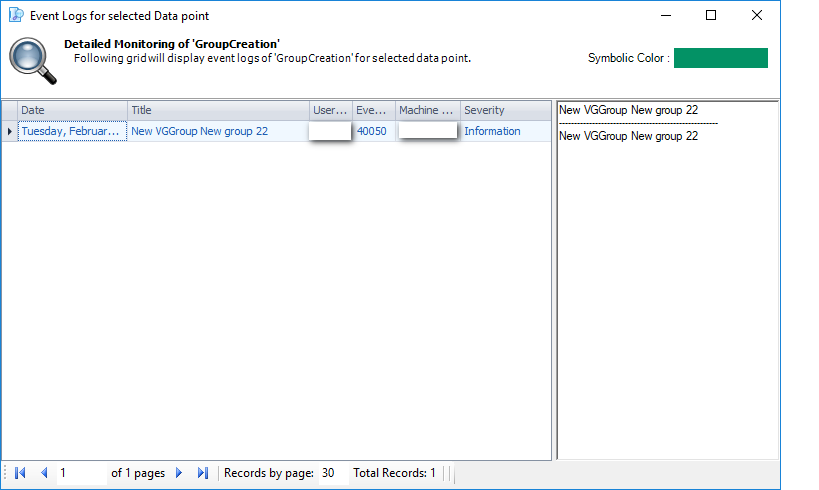
- Clicking on (B) will redirect to the screen displayed below

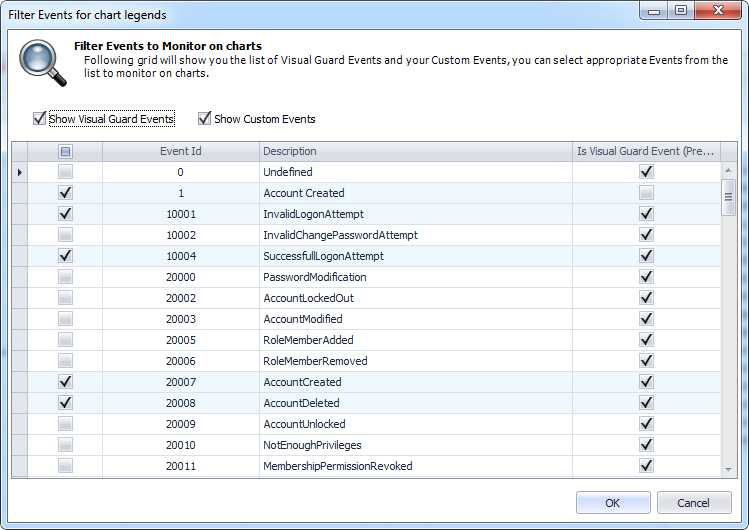
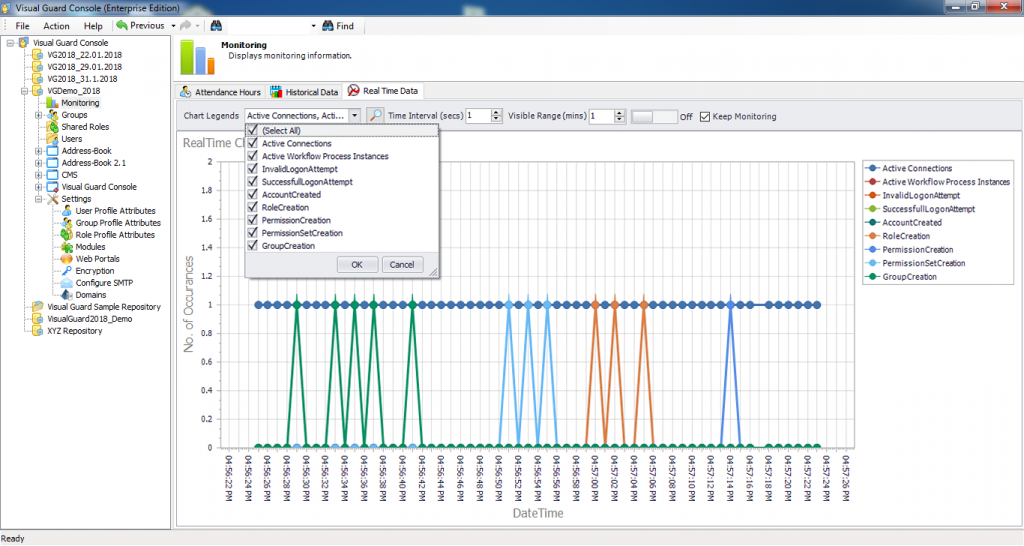
- Filtering the data through Chart Legends by clicking on hand lens icon will display the screen below:

- The selected options will be displayed besides the Chart Legends which can be deselected later.

- Time Interval: The user can set the regular time interval (in seconds) by which you can monitor the events.
- Visible Range: The user can set the visible range (in minutes) for real time charts.
- Keep Monitoring: If the checkbox is checked, the user can monitor the actions even when the real-time chart screen is active or inactive.
See Also: missing links
- Viewing Repository Details
- Viewing User Profile Attributes’ Details
- Viewing Modules’ Details
- Viewing Web Portal Details
- Viewing ADFS Server Details


